BR by the Numbers
by Barbara Westwood Diehl

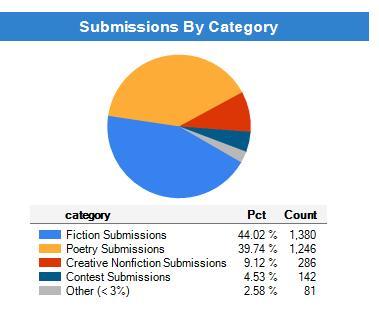
See that little pie chart to your right? That's not lemon meringue, hon. That's one of the three charts we see in our submission system, a snapshot of our submissions as of this morning (July 26 - April 6, to be exact, with the system closed in December and January). The "Other" category includes the video and visual submissions. So you can see it's mostly fiction, with poetry running a close second, and then creative nonfiction at roughly 9%.
About 8-9% of submissions are withdrawn by the author because they're accepted elsewhere, or they decide--oops--I need to edit that. (Guilty!) Many of these are withdrawn a very short time after they're submitted because another journal snags them first. Makes me mutter expletives under my breath, but that's the price we pay for accepting simultaneous submissions.
Over 3,000 of you and 14 of us.
For you Duotropers: Their stats are currently based on 365 reports from the last 12 months (a relatively small percentage, but still). The non-response numbers on their site pre-date our new submission system. With our new system, it is almost impossible to miss responding to someone. Our statistics have been slowly but surely improving on that site. If more of you report your submission response times there, our stats will improve rapidly. We work like dogs. Honest.
The Google Analytics: Since our first online issue went live, we have had 4,845 unique (Google's word, not mine) visitors, 26,082 page views, 3.96 pages per visit, with an average time per visit of 3 minutes and 13 seconds. (Make of this what you will.) The top ten countries visiting us are the United States (most visits, of course, at 5,911), United Kingdom, Canada, India, Australia, Germany, Israel, Italy, Japan, and Brazil.
Out of 152 countries, 30 countries did not pay us a visit--their loss. The visitor who spent the most time on our site was from Chile, clocking in at one hour and 20 minutes, followed by someone from Nepal at 24 minutes and 20 seconds, and from Guam at 23 minutes and 18 seconds. Thank you, Chile, Nepal, and Guam. Three folks from Serbia dropped by and spent an average of two seconds with us. Not even long enough for a glass of Slivovitz. Was it something we said?
Twenty-nine percent of our visitors are classified as "returning visitor." A promising start. I'll be looking to grow that.
Only a few of you shared us via email, Facebook, or Twitter. Easy to do, people. It's that tiny green icon next to "Share This" at the bottom of our website.
Stay tuned for other riveting statistics.
And speaking of tiny little icons and links at the bottom of our website, please click on the tiny blue "Donate" at the bottom of the page. That will take you to a lovely picture of a rowhouse on Broadway and a link to Paypal, where you can donate a few bucks to the journal. No amount is too small or too large. As noted there: "The Baltimore Review is a 501(c)3 not–for–profit organization staffed by volunteers. All contributions will fund costs associated with technology needs, print materials, mailing issues, and—our dream—paying contributors in the future for their work." We would love to be able to add some donation dollars to our stats. Thanks to everyone who takes the time to stop by the site. Linger next time.
